Credit Card Delinquencies, Payment Volume, Balances, Debt-to-Income, Credit Limits in Q2 2026: Americans and their Plastic
Credit card delinquencies decline as spending volume rises
WASHINGTON — Credit card delinquencies across U.S. commercial banks fell to their lowest levels since mid-2023, according to Federal Reserve data, even as total spending through credit cards reached record highs. The 30-plus-day delinquency rate on all commercial bank credit cards dropped to 2.85 percent in the second quarter of 2026, seasonally adjusted, from 3.04 percent a year earlier and 3.22 percent two years prior. The 60-plus-day delinquency rate, including private label and subprime cards, declined to 2.69 percent from 2.87 percent one year ago and 3.04 percent in mid-2024, according to Equifax data.
For prime borrowers, the 60-plus-day delinquency rate fell to 0.84 percent, the lowest point since before the pandemic-era period of low interest rates and widespread fiscal stimulus. Analysts attribute the improvement to stronger household finances following the end of pandemic-era support programs.
A separate issue involving 90-plus-day delinquencies has been clarified by the Federal Reserve Bank of New York. The apparent rise in severely delinquent accounts reflects older, charged-off debts that lenders have continued to report on credit files while attempting collection, rather than a sudden increase in nonpayment. The New York Fed noted in a recent blog post that in prior years, such charged-off accounts were typically removed from credit reports sooner, which had masked the true level of delinquency.
Despite rising balances, credit card debt remains historically low relative to income. Total credit card balances reached $1.26 trillion in the second quarter, up $54 billion from a year ago, according to the New York Fed’s Household Debt and Credit Report. However, most cardholders pay their statement balances in full each month, meaning interest is rarely incurred.
Credit card payment volume continues to outpace other forms of consumer payment. In 2024, U.S. consumers used credit cards for $6.51 trillion in transactions, an 11.7 percent increase over two years. Industry estimates suggest payment volume grew an additional 6.1 percent in 2025, reaching approximately $6.9 trillion. Visa reported a 9 percent year-over-year increase in U.S. cardholder spending in early 2026, following slower growth in late 2025. Consumers primarily use credit cards for smaller, recurring purchases such as dining, online shopping, subscriptions, and utilities.
Aggregate credit limits on all cards rose to a record $5.56 trillion, up $324 billion from the previous year. With balances at $1.26 trillion, total available credit reached $4.30 trillion — a level some analysts describe as a substantial cushion against overleveraging. The combined debt-to-disposable income ratio for credit cards and other consumer loans remained near historic lows at 7.75 percent, up slightly from 7.68 percent a year ago.
Other consumer debt, including personal loans and buy-now-pay-later arrangements, rose by $28 billion (5.2 percent) to $568 billion in the same period. This category, which generally carries interest, has seen modest growth over the past two decades despite inflation and population increases.
Despite aggressive marketing by banks offering cash-back rewards and travel perks, households have maintained disciplined repayment habits. Analysts note that credit limits have expanded far more rapidly than actual borrowing, leaving $4.3 trillion in unused credit capacity. This gap underscores the distinction between credit card use as a payment tool versus borrowing, with the vast majority of spending paid off before interest accrues.
The second-quarter data concludes a four-part series on household debt trends, including analyses of auto debt, overall debt burdens, and home equity lines of credit.
Comments (0)
No comments yet — be the first to weigh in.

Free School Uniform Swap Shop Saves Welsh Families £50m Annually
A Cardiff father's school uniform swap shop initiative has grown to 200 schools, helping Welsh families save £50m yearly while promoting sustainability and reducing clothing waste.

Poland, US Explore Permanent Military Bases: Defense Talks Underway
Poland and the US are discussing permanent American military bases in Poland, focusing on defense capabilities rather than troop numbers. Nuclear warheads are not part of the plans.

Taxpayers Lost $65B to Obamacare Fraud in 2024; Feds Crack Down
A Paragon Health Institute report reveals $65 billion in taxpayer losses due to Obamacare and Medicaid fraud in 2024, with improper enrollments rising in 2025.
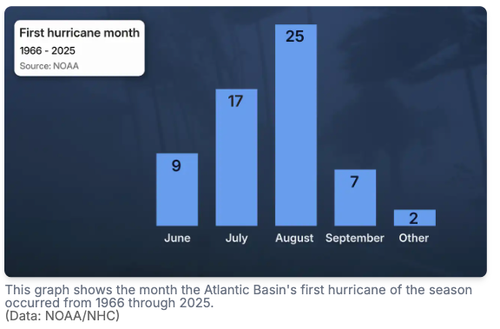
El Niño Delaying 2026 Atlantic Hurricane Season as Dolly Nears Florida
El Niño's wind shear suppresses 2026 Atlantic hurricane activity, delaying first hurricane as Tropical Storm Dolly's remnants approach Florida and the Caribbean.

Mumbai’s Vile Parle Cypher is giving unheard rappers a voice

Enrich and Ultimo impress

Karnataka CM Signals Review of 5% Park Land Amendment Bill in Assembly

