How Americans Spent their Trillions of Inflation-Adjusted Dollars on Goods & Services and How that Changed since 2015
Americans' consumer spending rose 5.9% year-over-year in July, not adjusted for inflation, according to the Bureau of Economic Analysis. Adjusted for inflation, spending edged up 2.1% from July 2023.
Of total spending, 66% went to services, 13% to durable goods, and 21% to nondurable goods. Healthcare services and housing costs together accounted for over one-third of total spending. Healthcare services, which include health insurance but exclude pharmaceutical products, made up 18.2% of spending, surpassing housing and utilities at 16.2%. The gap between healthcare and housing spending has widened since 2020.
Spending on nondurable goods, adjusted for price changes, dipped 0.2% monthly but rose 1.4% year-over-year. The largest category, "other nondurable goods," includes pharmaceuticals, medical supplies, toys, household supplies, and personal care products. Spending on gasoline, adjusted for price changes, was slightly down, continuing a long-term trend of falling gasoline consumption due to increased vehicle fuel efficiency and the rise of electric vehicles.
Spending on durable goods fell 1.4% monthly but rose 1% year-over-year. "Recreational goods and vehicles" became the top durable goods category in 2021, surpassing motor vehicles. This category, which includes items like motorhomes, ATVs, musical instruments, and camping equipment, accounted for over 5% of total spending at its peak in late 2023. However, spending has since declined, with a 5.5% drop from the November peak, including a 1.4% plunge in July.
The data is adjusted for inflation specific to each category and expressed in 2017 dollars. The figures represent annual rates.
Comments (0)
No comments yet — be the first to weigh in.

Free School Uniform Swap Shop Saves Welsh Families £50m Annually
A Cardiff father's school uniform swap shop initiative has grown to 200 schools, helping Welsh families save £50m yearly while promoting sustainability and reducing clothing waste.

Poland, US Explore Permanent Military Bases: Defense Talks Underway
Poland and the US are discussing permanent American military bases in Poland, focusing on defense capabilities rather than troop numbers. Nuclear warheads are not part of the plans.
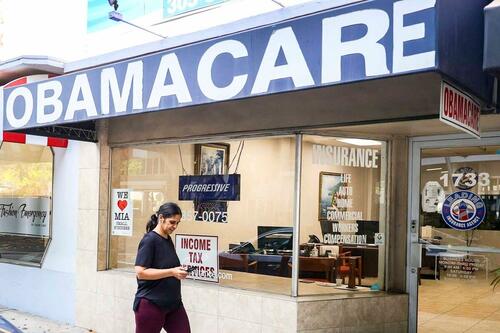
Taxpayers Lost $65B to Obamacare Fraud in 2024; Feds Crack Down
A Paragon Health Institute report reveals $65 billion in taxpayer losses due to Obamacare and Medicaid fraud in 2024, with improper enrollments rising in 2025.
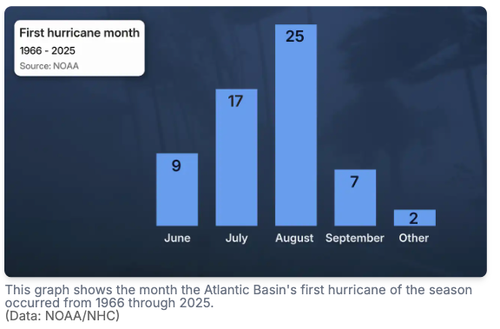
El Niño Delaying 2026 Atlantic Hurricane Season as Dolly Nears Florida
El Niño's wind shear suppresses 2026 Atlantic hurricane activity, delaying first hurricane as Tropical Storm Dolly's remnants approach Florida and the Caribbean.

Mumbai’s Vile Parle Cypher is giving unheard rappers a voice

Enrich and Ultimo impress

Karnataka CM Signals Review of 5% Park Land Amendment Bill in Assembly

